Customizable dashboard
Customizable dashboard
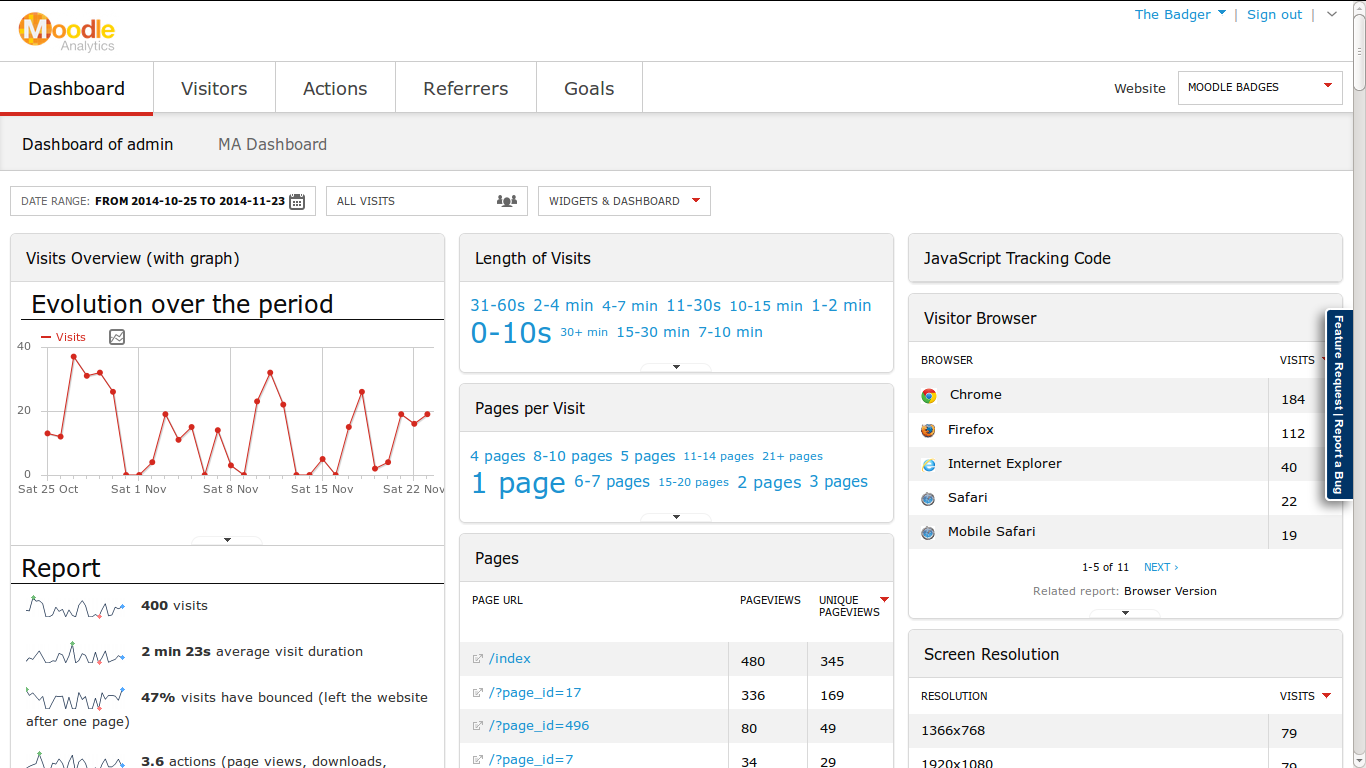
Moodalytics Customizable Dashboard gives you a quick and easy access to information about your Moodle LMS. Deep analytics allow you to drill down and filter for specific insights. You can select between more then 70 widgets to create a personalized dashboard to best suite your needs.
Graph reports

Graph reports
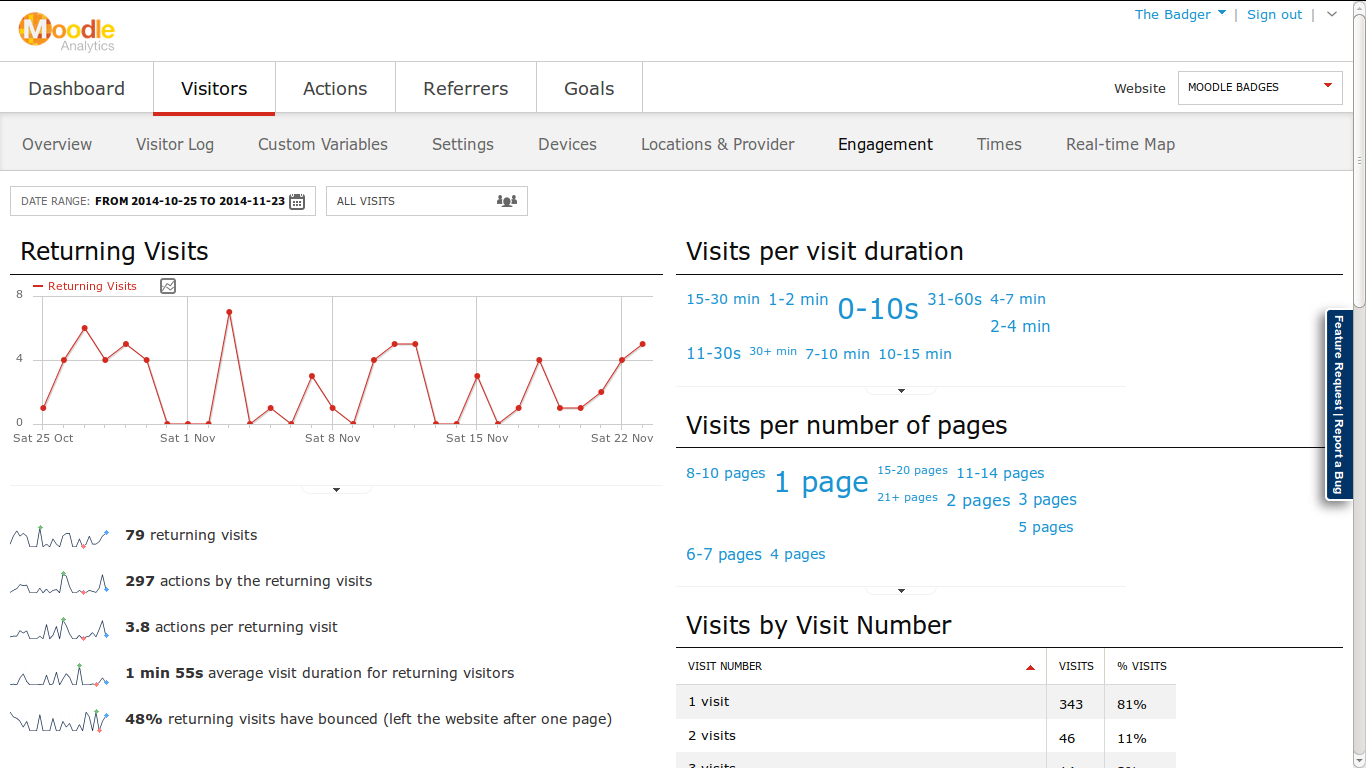
Graphs give you details about trends on your Moodle LMS over time. You can mark positions on graphs and add notes so that you can track changes later on.
Table report
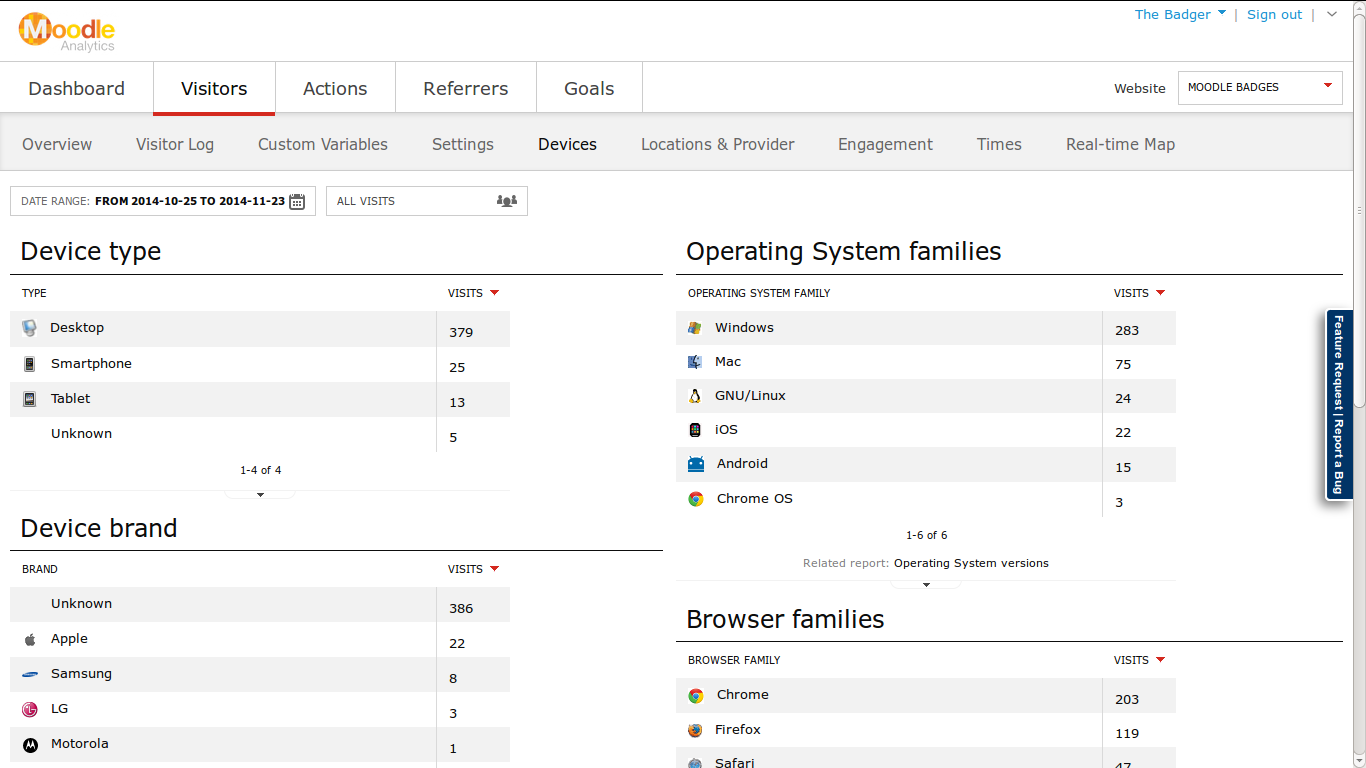
Table report
Some data is better shown in simple tables. You can always convert that data in graph and
Combine reports
Combine reports
Beside tables and graphs you can also have tag clouds in your reports. This way all data can be shown in different formats helping you drill down all the information you need.